 |
Factory and production is visible Kap@sitas Kyoritsu Electric (Vietnam) Co.,Ltd. Kyoritsu Electric Corporation. |
1, Purpose
| ・ Production site of visualization
・ Reduced downtime ・ Loss survey ・ Reduce aggregation time |
Visualize production operating status and display on PC monitor.
Notify the equipment status at a glance. Real-time information gathering of facilities , Visualization of loss through analysis. Automatic collection and aggregation of facility information greatly reduces aggregation time. |
2, Characteristic

・ Introduction cost can be reduced by wireless, and it can be introduced with less investment.
・ Signal extraction is possible simply by adding it to PATLITE Signal Tower (LE) of the facility.
・ Collected data and compiled data are stored in CSV, so you can reference and compile with Excel etc.
・ System expandable in stages.(for Small system ~ IoT smart factory compatible)
3, Kap@sitas Facility operation monitoring System configuration
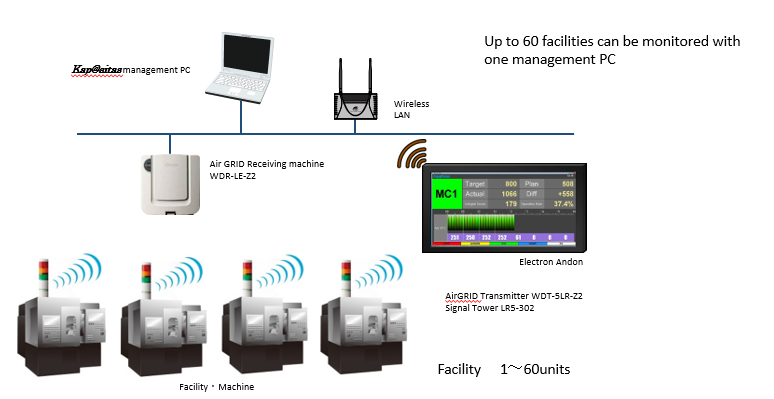
3-1.Kap@sitas Standard
Number of connected equipment ~60 units
3-2.Kap@sitas Professional
Number of connected equipment ~600 units

Operation data is managed in a centralized manner in Database Server,
Information on all connected equipment can be monitored with management PC, Electron Andon.
3-3.Kap@sitas Premium( Web Monitor Version)
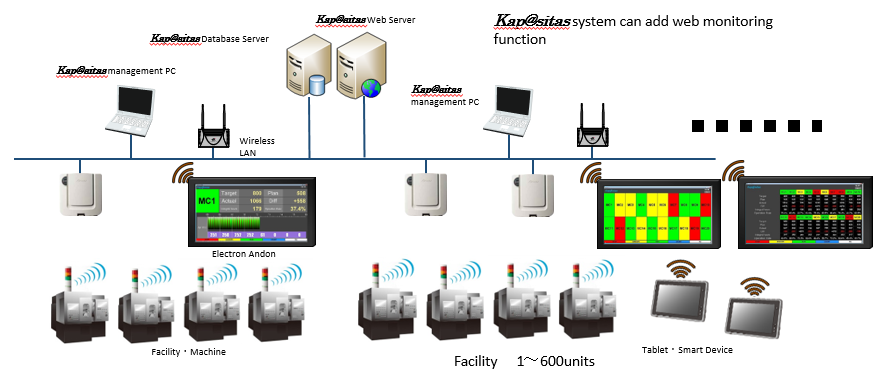
Facility information can be browsed by web browser, monitoring is possible from mobile terminals such as Windows, Android, iOS, etc. connected to the network.
3-4.Kap@sitas for IoT
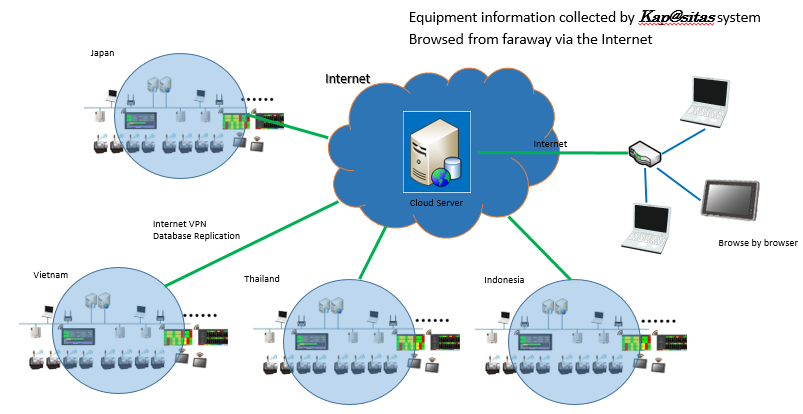
We synchronize facility information with web browser publishing server, manage huge device information at each site, compare data between bases, and see information from a remote place via internet line.
4, Function
Monitor function
・State Monitor
Display status of equipment (signal light on condition) in real time on the screen.
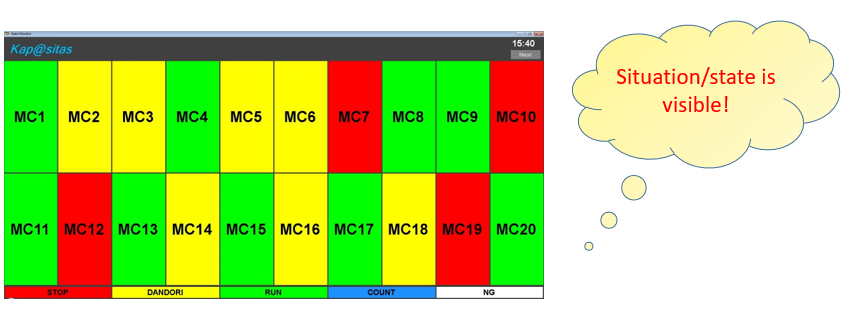
Receive the status of the equipment in real time and change the display color to display.
We will display what kind of equipment is stopped at a glance so that we can respond promptly to recovery.
・Production Monitor
Real time display of equipment status · planned number · actual number · progress · achievement
rate・operation time · operation rate · abnormal time · number of abnormal times · setup time ·
setup number etc

You can quickly confirm the state of progress (lag) of production.
・Operating Gantt Chart : State change display in time series of each machine (per shift)
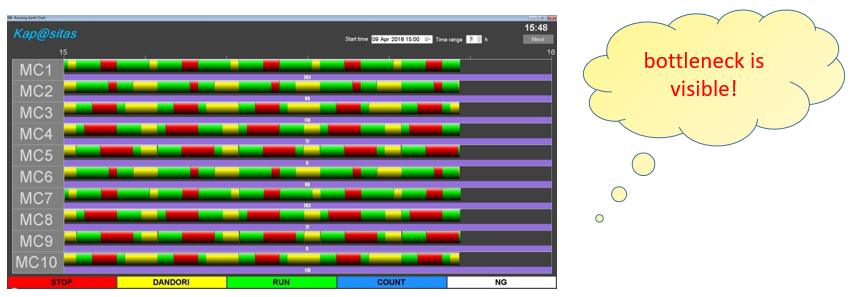
You can instantly check the equipment and time zones that are bottlenecks in a short time stop or wait.
You can check the actual number of each hour.
Aggregate ・ Operation history management function(CSV file output)
・ Daily report schedule : Aggregate production results every hour
・ Monthly report : Aggregate production results daily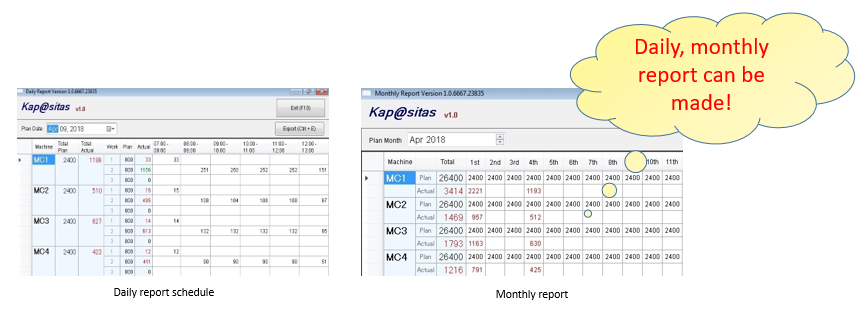
You can easily check the production results for each machine at any date and time.
It is also possible to process data using Excel.
・ Signal tabulation : Calculate operation, stop, wait time, number of times, etc. for each machine
・ Log schedule : Aggregate for each machine in chronological order
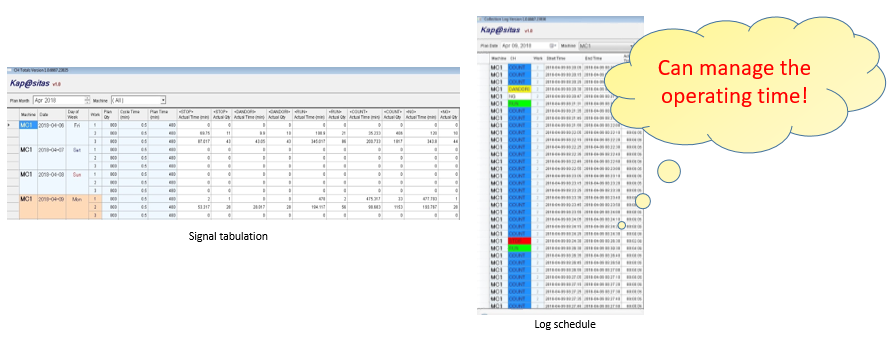
You can check the performance of each machine on a daily basis and analyze it for productivity improvement.
It is also useful for checking the situation at the time of trouble occurrence.
・Andon display function (optional)
View the site status by the production line on the screen
By setting up Andon on each production line, plant managers, site managers and workers can monitor the
situation at any time
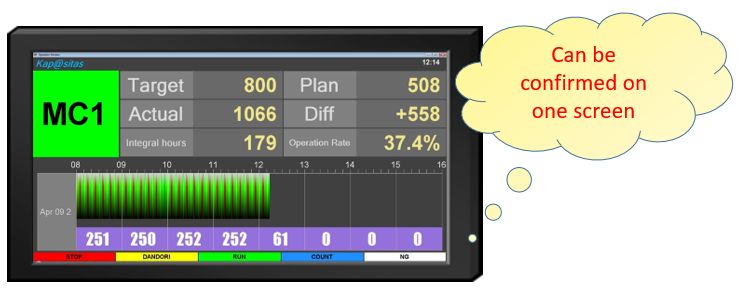
Monitoring through the Andon is possible to those need the information necessary for
The production line.
Contact them if you need assistance
Thank you
