Vibration Analysis Program
SX-A1VA

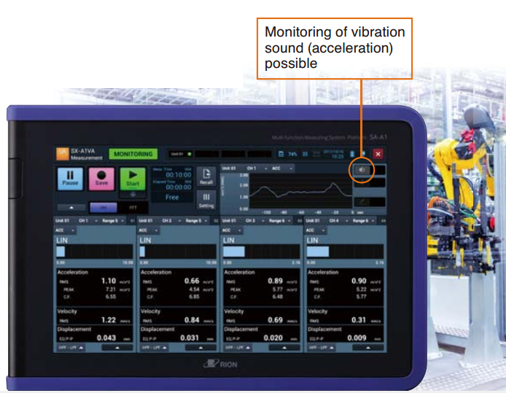
This program adds vibration measurement functions to theRIONOTE Multifunction Measurement System.
All essential vibration measurement functions are provided, enabling equipment diagnosis and trend management for industrial machinery.
The program also supports detailed diagnosis including FFT analysis and envelope processing, and ISO absolute value evaluation can also be performed.
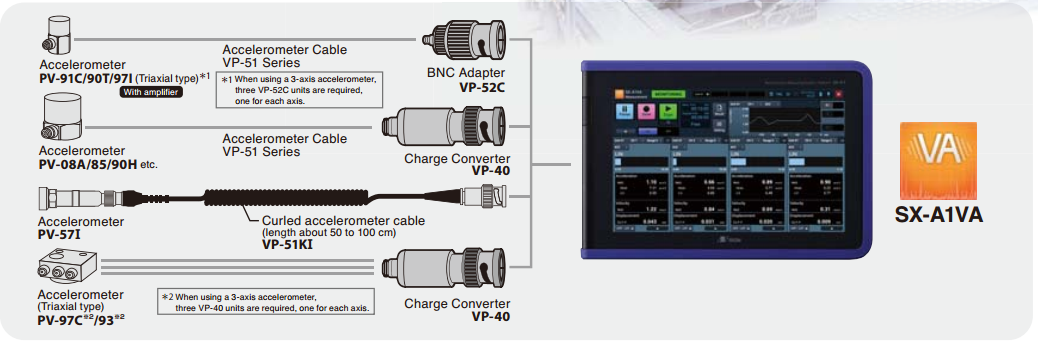
Because up to four accelerometers can be connected to the RIONOTE, simultaneous measurement in two horizontal directions and one vertical direction or other measurements of multiple planes can be easily realized.
| Vibration meter mode
● Measurement simultaneously for vibration acceleration, velocity, and displacement ● Auto store function continuously records vibration values and tacho data in 100 ms intervals ● Calculation of average vibration quantity values for a specified measurement period (to facilitate reading of representative values for measurement data with considerable fluctuation) ● Separate filter settings (HPF, LPF) for acceleration, velocity, and displacement are supported |
 |
Connection examples

Simple diagnosis
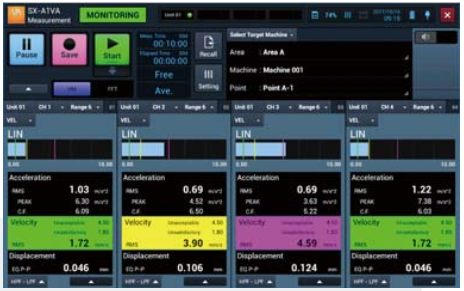
| By periodically measuring the vibration magnitude and comparing the results to a reference value, the equipment condition (normal or potential problem)can be diagnosed.
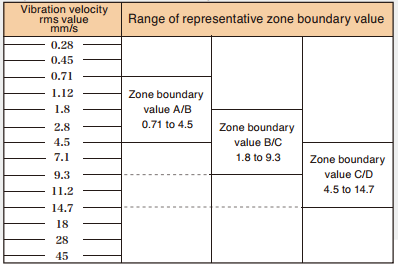
The example at right shows the screen in absolute measurement mode for four channels. Because the danger state is indicated by purple-red, caution by yellow, and good by green, the display of measurement results lets the operator assess the state of vibration at a glance. Absolute value evaluation mode (absolute value evaluation function) ISO 10816 series (Evaluation of machine vibration by measurements on non-rotating parts).
●Reference value
Standard mode (evaluation function) Two threshold values (upper and lower) each are set for acceleration, velocity, and displacement to perform evaluation. |
 Representative zone boundary value
|
Detailed diagnosis (FFT analysis and envelope processing)
The FFT analysis function and envelope processing function (acceleration envelope processing) can be used to determine abnormal conditions and to assess failure stage and location. Three examples for analysis using patterns to analyze vibration causes are shown below.
Bearing fault
The bearing fault manifests itself by large acceleration. Envelope analysis reveals peaks at regular intervals, as shown in the illustration. When the dimensions of the bearing parts, number of rolling elements, number of shaft revolutions etc. are known, the faulty part can be determined from the primary frequency of the series of peaks.
Misalignment
In the case of misalignment, a large frequency component that is an integer multiple of the number of revolutions appears in the axial direction. The multiplication factor of the vibration component depends on the type of bearing.

Unbalance
Unbalance is a condition that occurs in the rotary direction. It is characterized by an increase only in the vibration component that is equal to the number of revolutions. Other vibration frequency components will show almost no change. The vibration amplitude is proportional to the degree of unbalance. When the rotation frequency increases, the amplitude increases by the square of the number of revolutions.

Trend management (relative value evaluation)
| SX-A1VA program can store the data tagged with information of the measurement point and can output the data all together for each measuring object. By using spreadsheet software such as Excel enables trend management of the machinery condition. In order to assess changes in the vibration of rotating machinery or similar which can indicate problems and possible causes, it is necessary to effectively accumulate and manage measurement data. Reference values can then be determined based on these data for example to set caution and danger threshold values. |
When a caution threshold is exceeded, monitoring should be strengthened, and when the danger threshold is reached, detailed diagnosis will normally be performed. With many common types of vibration acceleration, values that are about 2 to 3 times above normal are considered caution indicators and a further increase by a factor of 2 to 3 will indicate a danger state. For a given piece of machinery, vibration measurement location, measurement direction, and measurement period are determined, and a graph in which measured values are entered in a time series is created (trend management graph). |
 |
 |
 |
 |
Please contact us if you need assistance.
Thank you

